

Custom Reporting (1)
For advanced reporting, the Custom Reporting feature is available and enables querying & exporting of all campaign data available in the platform. It can be accessed from the platform sidebar.
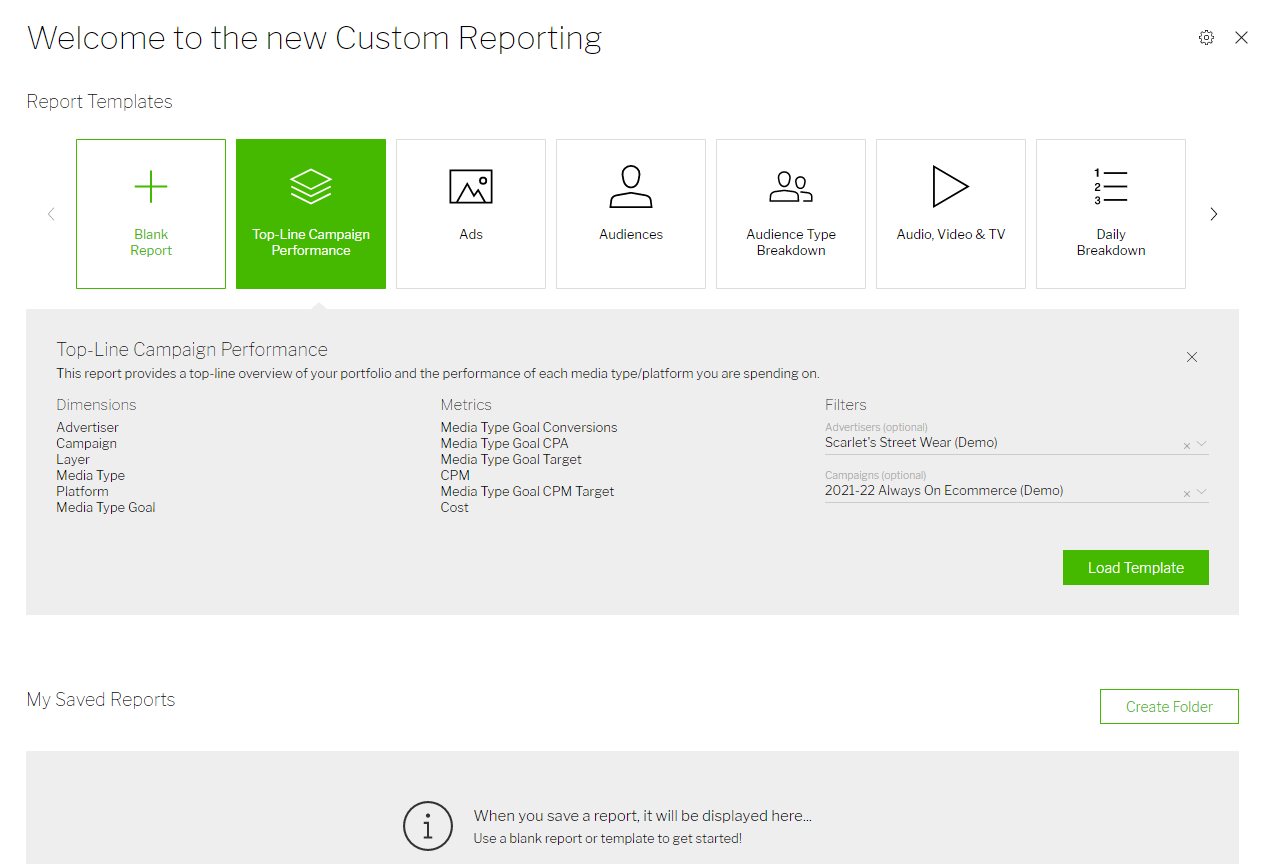
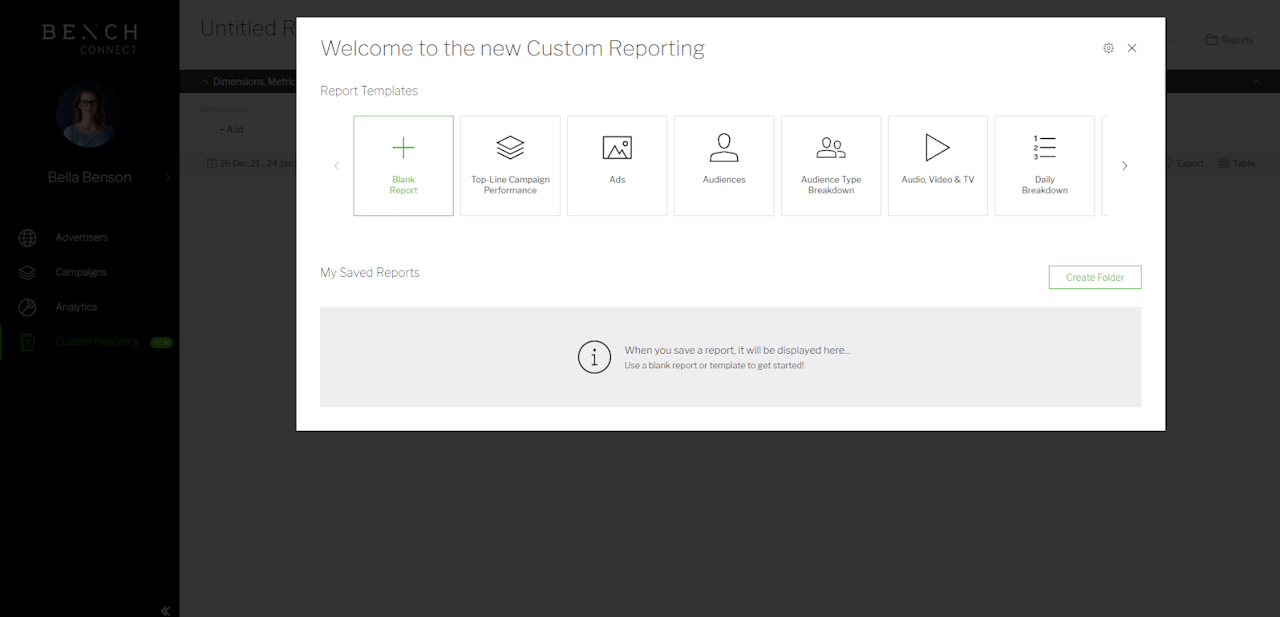
Reports can be generated using templates or from scratch by customising the dimensions, metrics & filters. These options will be available when initially loading the Custom Reporting tool and can be brought up again by selecting the ‘Reports’ icon in the top right corner of the screen.
When selecting a template, pre-populated dimensions & metrics will be displayed. Filters for Advertisers & Campaigns can optionally be added. Once the template is loaded, further customisation to the dimensions, metrics & filters can be made.

Custom Reporting (2)
Dimensions, Metrics & Filters
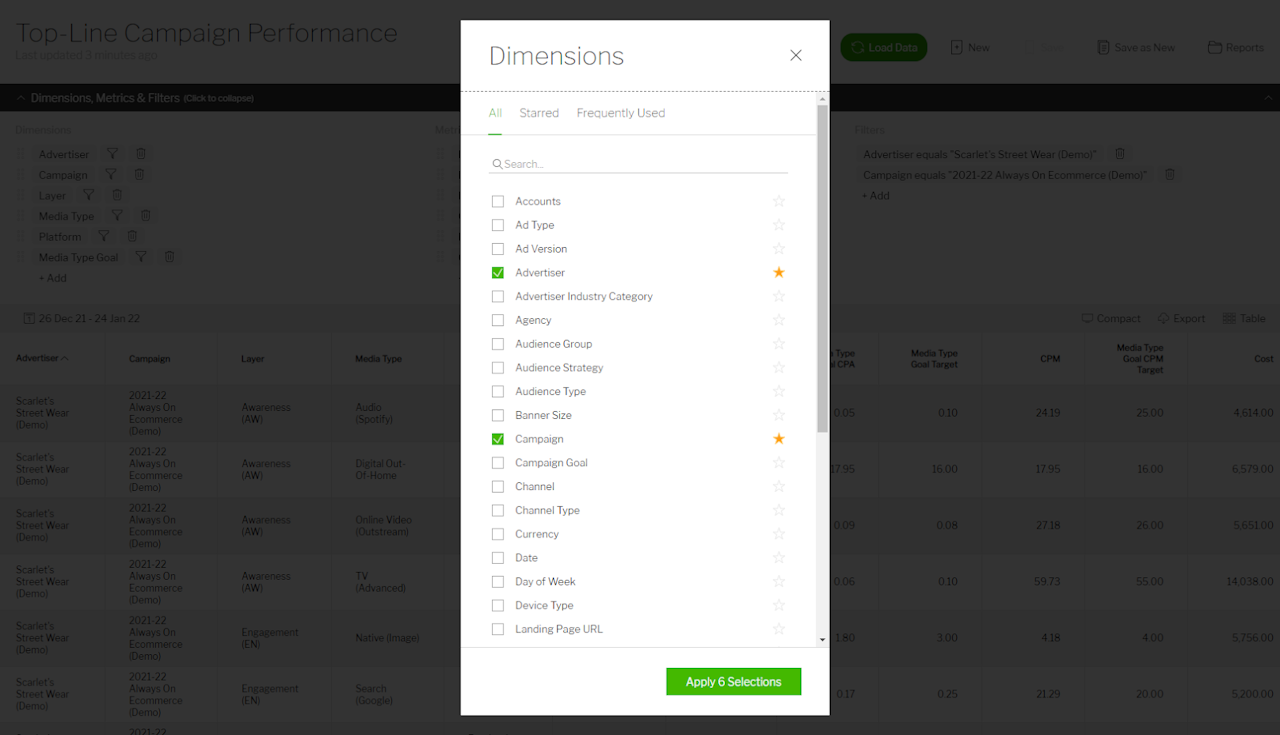
To add or adjust dimensions, metrics & filters on the reporting screen, click to expand the ‘Dimensions, Metrics & Filters’ bar and click into the respective sections.
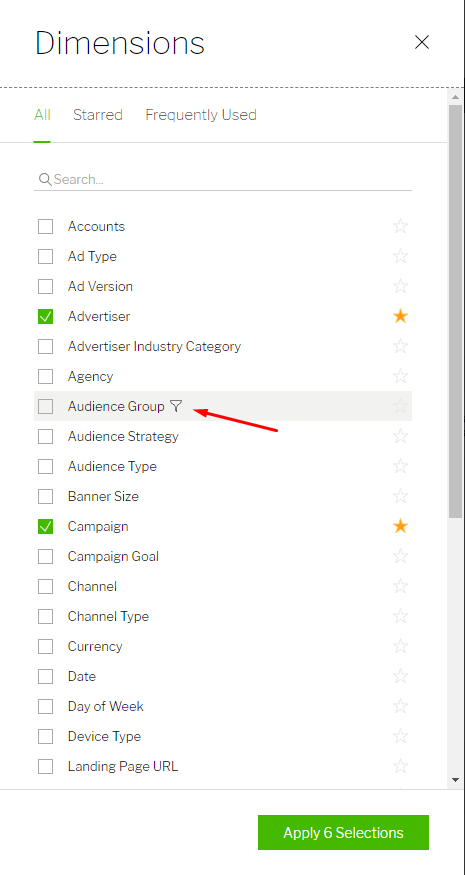
Dimensions & Metrics can be selected and also starred for quick access. Frequently used Dimensions & Metrics will also populate based on the usage.
Filters can either be selected within the dedicated ‘Filters’ section or by hovering over the dimensions during the selection process.
The selected dimensions can also be filtered directly once they are selected in the report.
Re-order dimensions & metrics as required by dragging & dropping and then click the ‘Load Data’ button to load the report. Toggle between the ‘Compact’ & ‘Comfortable’ views to control the density of the data displayed.
Bundled vs. media cost
Cost-based metrics can be toggled between two modes using the adjacent gear icon. These include ‘Cost’, ‘CPC’, ‘CPM’, ‘Media Type Goal CPA’ & ‘Campaign Goal CPA.’
The two modes available are ‘Media Cost’ which is the raw media cost from the ad platform/DSP & ‘Bundled Cost’ which is the ‘Media Cost’ multiplied by the System Factor for the allocation.

Custom Reporting (3)
Saved reports
New reports can be saved by clicking on the ‘Save As New’ button at the top of the screen. Once the report is named and an optional description is added, it can be saved and organised into folders. Create a new folder by opening the ‘Reports’ popup and clicking on the ‘Create Folder’ button. Drag and drop reports into folders as needed. Existing reports can be updated with changes by clicking on the ‘Save’ button.
Exporting & Scheduling
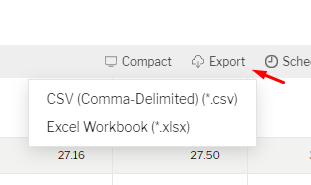
Reports can be exported to .xlsx and .csv formats by clicking on the ‘Export’ button.
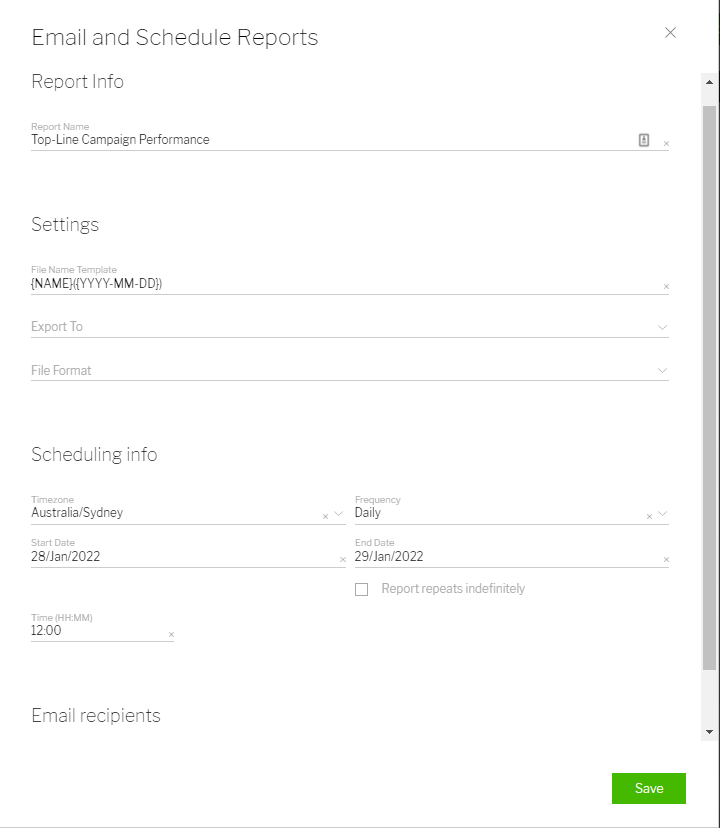
They can also be scheduled via an email or to a FTP, SFTP or Google Data Studio dashboard by clicking on the ‘Schedule’ button. Fill in the required settings & scheduling information to schedule the report.
Scheduled reports can be edited & accessed from the platform sidebar.

